The detection and classification of stops of meal couriers
Context ↑
The union ACV wanted to reach the gig economy workers, and in the context of this project, the meal couriers (Deliveroo, Take away, ...). To help with this they wanted to make an app which is easy to use and gives some insight into actual working time vs waiting time. They asked the UCLL's Digital Solutions group to develop this.
The main objective is to determine when a meal courier picks up a meal at a restaurant, and when he delivers it to a customer. This without any interaction from the courier. He just starts the app at the start and finishes his session when it's over.
In an initial phase three teams of four students worked on a small prototype as their graduation projects. At around the same time I reached out to the UCLL in search of a practical thesis topic and we decided that I would join the team and handle the calculations part.
End result - the detection and classification pipeline ↑
To go from raw sensor data arriving (and being reassembled) on a server to a list of restaurant and customer timestamps being sent back, we go through the following steps:
- Stop detection
- Feature extraction
- Individual classifications
- Final classification (big picture)
Stop detection ↑
The stop detection happens in three phases:
- MovingPandas basic stop detection
- Stops refinement algorithm
- Post clustering noise filtering
We only need restaurant and customer stops, but customer stops can be extremely quick, it's possible for a rider to drop off the package and be gone in 20 seconds. We start with MovingPandas built in stop detection algorithm, which checks if gps points stay within a specified radius for a specified amount of time.
However, since raw gps data from smartphones can be very noisy, each stop gets further refined by a complex algorithm that includes the 'appendages' if they return to the original stop's convex hull. Then the appendages get cut off based on speed (so if someone slows down for a red light, stands still, and starts moving again, then only the interesting middle part remains). Any stops that are less than 10 seconds after this step gets filtered away, and all stops close to each other get clustered together.
The image shows an example of a single actual stop being split into five by noise on the gps data.
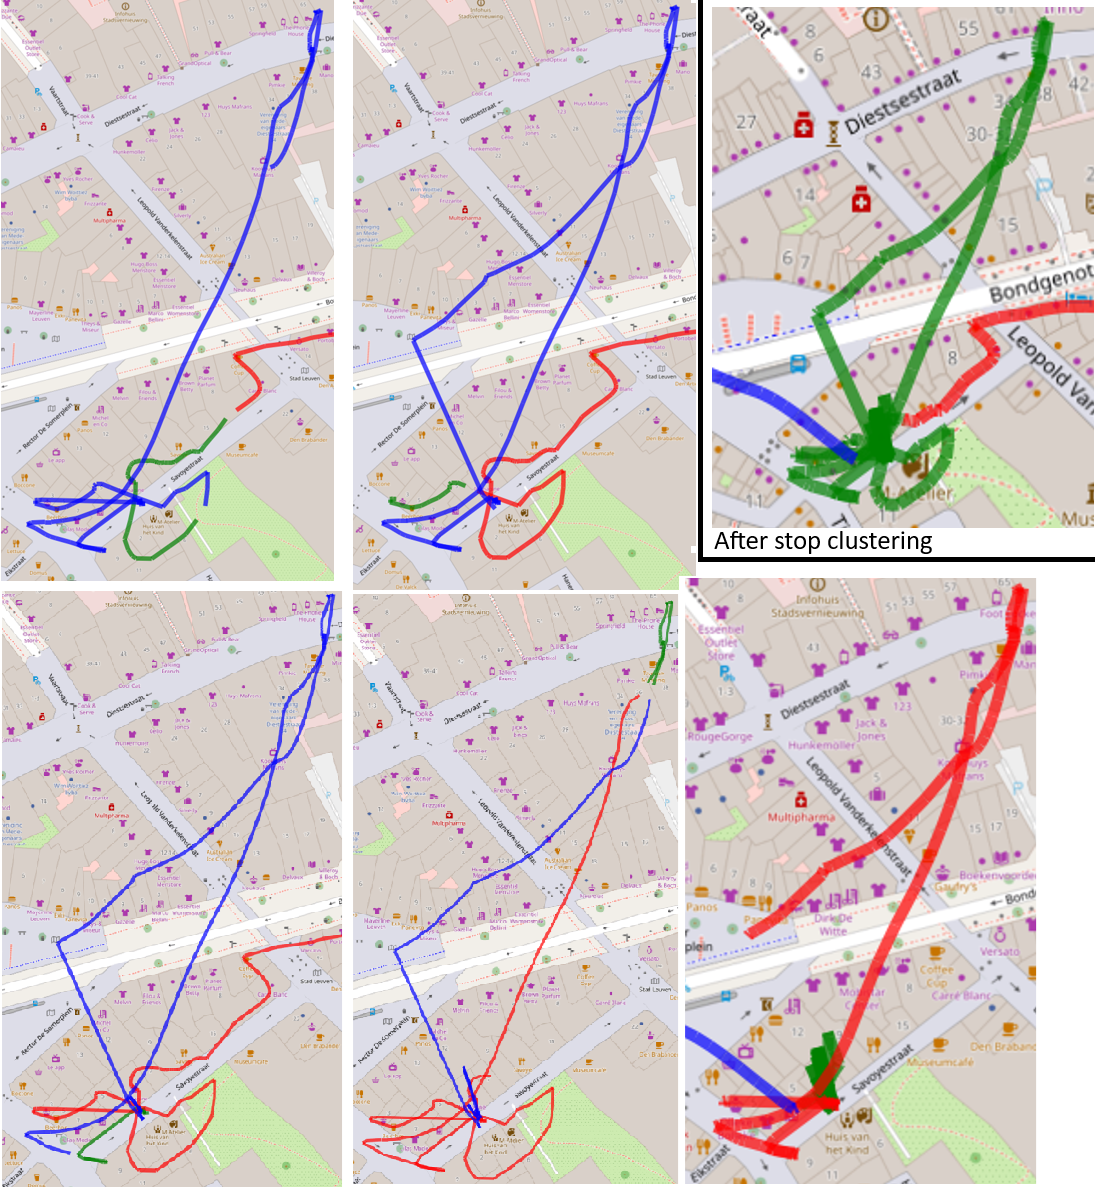
The end result is a list of distinct real stops.
Feature extraction ↑
For each stop we extract a bunch of features. Some are simple, such as how long the stop is. Here also non-gps data gets used, such as the accelerometer. Besides smartphone data, we also check the proximity of restaurants and certain traffic features (stop lights, junctions) using Openstreetmap's data. Using the dynamic timewarp algorithm we also check if the courier backtracks, i.e. follows a similar inbound and outbound path (turning around implies reaching a destination).
Individual stop classification ↑
Using these features, each stop gets classified into restaurant, customer or other by a machine learning model (A Random Forest classifier). Besides the main classification, we also keep track of the probabilities (how certain a classification is).
Final classification step ↑
The previous step classified each stop individually, but by leveraging knowledge about a sessions structure, we further improved the accuracy. A restaurant is followed by one or two customers, never a restaurant. Similarly, a customer won't be the first stop of the session. Also, while the total time of a delivery can be long, if it's significantly longer than the longest observed delivery time, it's probably wrong.
An algorithm looks at all the classified stops together and makes some adjustments. For example, if the first 'interesting' stop is a customer, then it looks through the preceding stops (all classified as other) and takes the one with the highest probability of being a restaurant.
The process: my thesis journey ↑
As mentioned, I was part of a team at the UCLL working for the ACV union. Before I started some effort was done already to make a prototype. An intern was further developing the smartphone application, while I started on the classification problem.
Smartphone app and testing data ↑
One of the first problems was the lack of real testing data. It turned out that the data used so far was simulated, i.e. team members using the app to track their gps for relatively short amount of time (15-30 minutes while the real sessions were 1-4 hours) and acting in how they thought the meal couriers might act.
When actual meal couriers were recruited to ride with the app, problems were uncovered. Giant gaps were present in the data due to power saving modes disabling the app. The app, being made with Flutter, couldn't make a background process that would keep running. After weeks of troubleshooting the issue it was decided to have a new group of students make a Java Android app, to be ready in March.
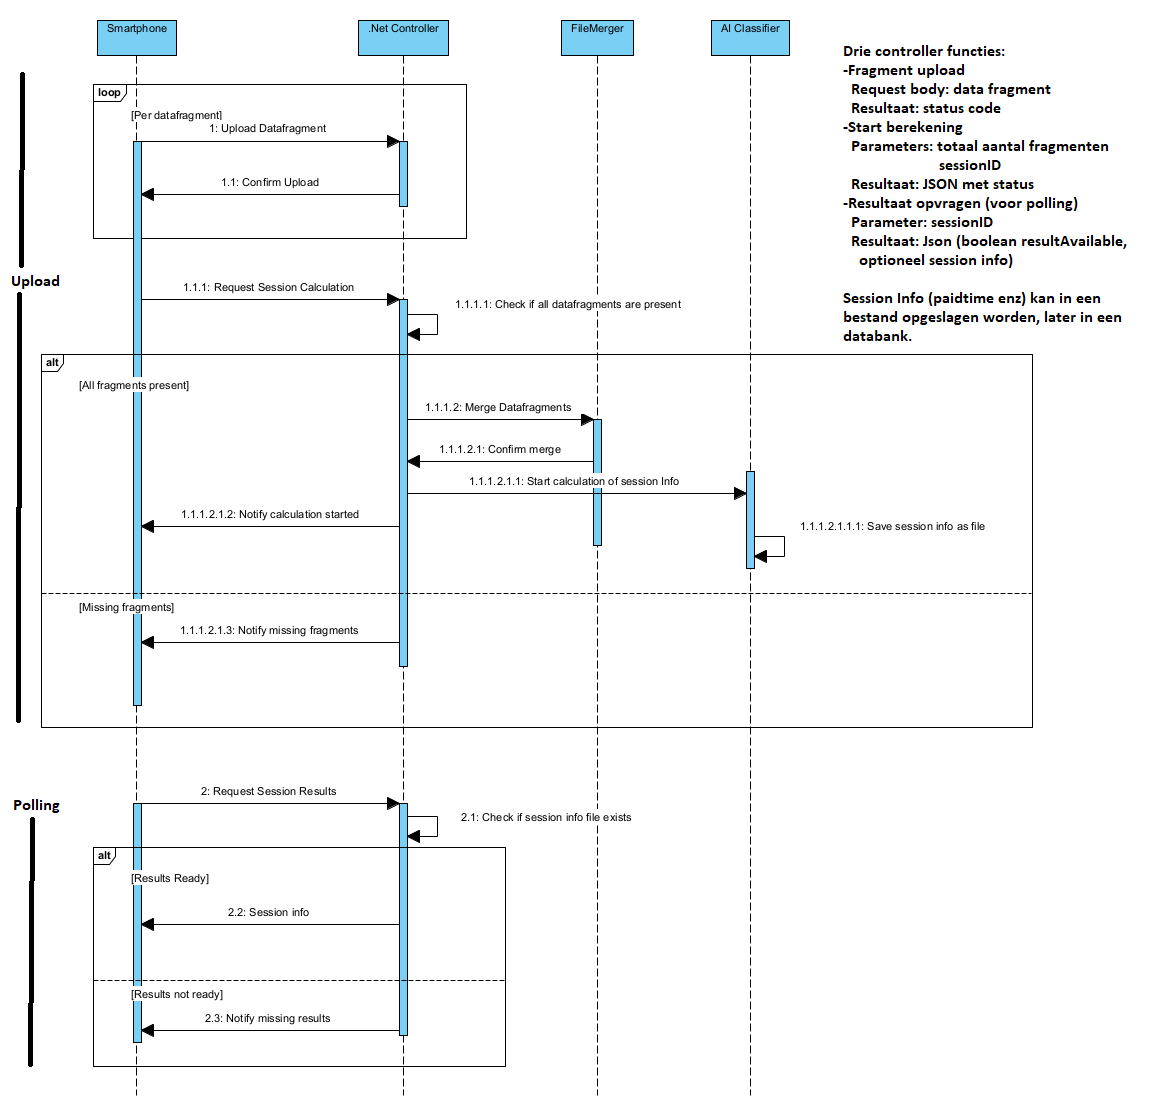
As proper data was crucial for me, I made the decision to just make a temporary DataTracker app on my own that would gather data from a bunch of sensors, had buttons to label when the courier was at a restaurant or customer, and robust uploading capabilities (along with an asp.net server to which the data was uploaded). It took me about 2-3 weeks, including testing by couriers.
Couriers sometimes forgot to press the label button, or only remembered after a minute. To make sure the data was properly labeled I asked them to send screenshots of their work app about their deliveries. I adjusted the Python code for the main pipeline to make tables of the stops and generate images of the stops along with their inbound and outbound paths. All of this, cross referenced with google maps, made it possible to efficiently add or correct labels.
Detecting and classifying stops ↑
Due to the project management style, there was a strong initial focus on visible weekly progress. Along with the initial lack of quality data and my lack of machine learning experience, I spend most of my time making rule based classifiers. One of the more advanced features, the dynamic timewarp based backtracking detection was made back then. Apart from that, I also spent time on making the analysis tools that I would use throughout the project.
By making the separate smartphone app I disconnected myself from the general project's flow and was left to do my own thing. With this breathing room and help from an UCLL researching acting as my technical coach, I got into machine learning and started experimenting with various features and models. First using Weka, later in the main Python project with Scikit.
As I spent more time with real courier data, I started noticing just how noisy it could be at times and how it affected my results. In tandem with testing different features, I worked on the stopclustering algorithm mentioned above, going through several iterations. This was a crucial step as the split stops implicitly meant a lot of wrongly labeled stops. That is, if a courier spends 5 minutes at a restaurant, and that gets split in three due to noise, then only one of those three would actually be labeled as the restaurant stop. To test the stopclustering algorithm I manually checked the results of the 24 sessions I had available at the time. The final algorithm reduces 1382 stops detected by MovingPandas to 590 stops. A manual inspection of these 590 stops found only 16 mistakes (from a 738 mistakes, and with an additional 71 correct but unimportant stops being filtered).
As I progressed to higher accuracies on individual stops, I noticed that the end result sometimes made little sense even when I had 90-92% accuracy. This gave me the idea to use my domain knowledge to improve the classifications. Here I again iterated over several rule based algorithms. The final result was an improvement of the classification accuracy from 91% to 96%. A more practically important metric, the error in total delivery times, went from 2961 seconds (for the entire test data set) to 285 seconds. This on a total delivery time of 22953 seconds, so from 12.9% too much to just 1.2% too much.
Directing students ↑
The great majority of the development work was done by students, with two researchers of the UCLL mostly managing the project, in close communication with two representatives of the ACV. In the second semester of the academic year this included a team of 4 students doing their graduation project, an intern, and one student enrolled in a program to help out about one day per week. The latter one was assigned to me, while the rest worked on the smartphone application.
While the smartphone app was out of scope for my thesis, I had made the actually working data tracker app and knew what sensor data was important, so I was involved in giving advice, requirements (both in capabilities and the format of the data and result) and answering their questions. For this, and some setup tasks after the thesis, the UCLL enlisted me as a part-time jobstudent.
The student assigned to me worked on improving the server code and helped with the label checking.
Handover ↑
After the practical work of the thesis was finished, I wrote several guides and made some tools to make it possible for the ACV to maintain the project themselves. Specifically, so they could label newly added data and use that to generate new classifier models.